Learning From Health
A data science project that leverages data from the Centers for Disease Control and Prevention (CDC) to develop predictive models for income, based on health statistics such as diabetes, cholesterol, and kidney disease.
Timeline
Jan 2022-Mar 2022
Technologies
Python, Pandas, Matplotlib, Seaborn, Scikit-learn
Tools
Jupyter Notebook
My Responsibilities as Data Scientist
- Perform background research and define a specific research question.
- Collect data and conduct data cleaning and pre-processing to prepare the data for analysis.
- Carry out Exploratory Data Analysis (EDA), perform relevant analysis, and interpret the results in the notebook.
Background
Poverty has long been linked to health disparities, with income strongly correlating with life expectancy. Low-income individuals face barriers to healthcare access, higher rates of behavioral risk factors, and environmental challenges.
Problem Statement
Recent trends show an inverse correlation between obesity rates and household income, influenced by geographical, cultural, and racial factors. Despite some conflicting studies, the overall trend suggests a connection between income and general physical health.
Hypothesis
Our hypothesis suggests that the connection between income and health stems from disparities in access to healthcare, healthy foods, and environments conducive to healthy lifestyles, leading to a higher prevalence of health issues among lower-income individuals. Considering the heterogeneity of income across the United States, the hypothesis suggests that geographic location may serve as a confounding variable in this trend. The overarching hypothesis proposes the ability to predict income based on health conditions and geographic location, given the observed trend between health and income.
Data Science Process
We began by identifying existing background research, finding relevant datasets, and defining a specific research question.
Then, we moved on to data cleaning and pre-processing to prepare the data for analysis.
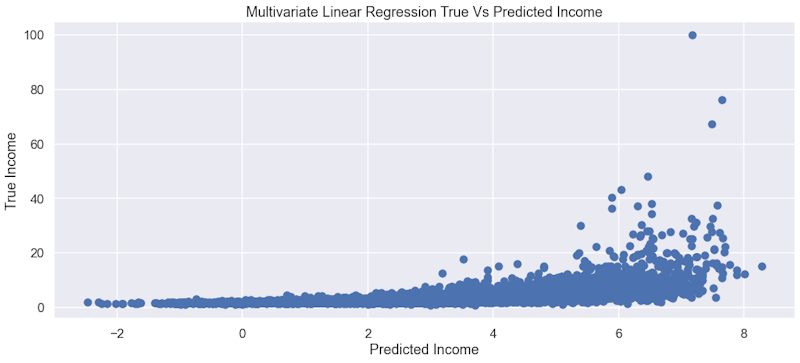
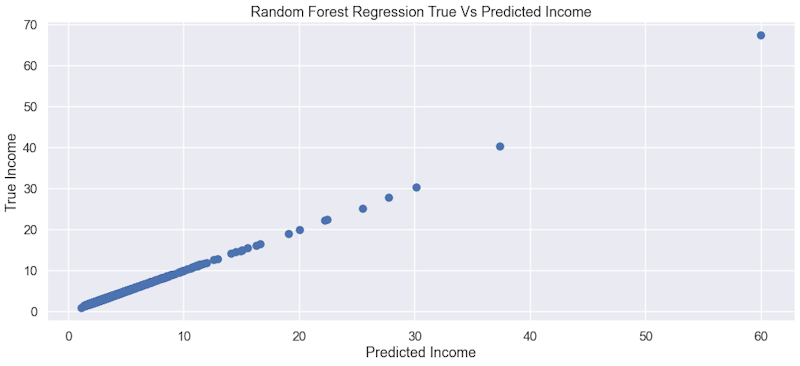
Finally, we carried out Exploratory Data Analysis (EDA), performed relevant analysis, and interpreted the results in the notebook. Below, we can see our initial model, a multivariate linear regression model, and our final model using a random forest regressor.
Final Product
Using a random forest regressor, we were able to predict income with an accuracy of 99.62% with an equally low mean squared error value of 7.4462. As shown in the plot, the relationship between true income and predicted income seems to be linear, with a few outliers.
Reflection
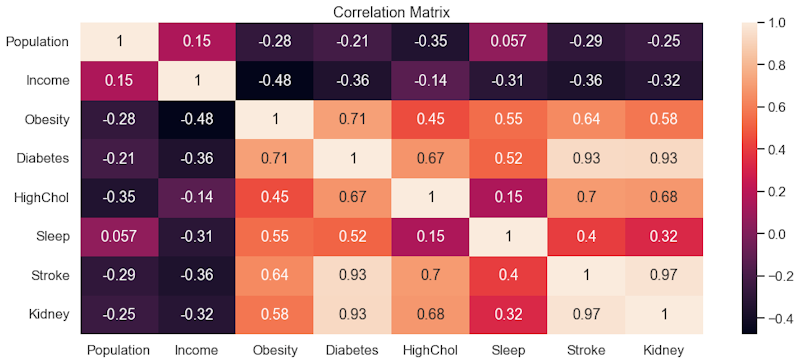
Most health conditions ended up having positive correlations with each other along with a negative correlation with income.
Our data has a major limitation of not including uninsured people which would likely skew the data more.
The main dataset is from the CDC, and we don't know how they categorized metrics like obesity and diabetes, so we lose out on some granularity.
Complete Report