Web Analytics Dashboard
A web app with a private dashboard to track and see how people are using a website.
Role
Developer
- Timeline
- May 2023
Technologies
- JS
- Node.js
- Express.js
- MySQL
- ZingChart
- ZingGrid
Tools
- DigitalOcean
- GitHub
- MySQL Workbench
- Postman
Background
I built this dashboard because I wanted a way to see how people were interacting with my websites. Generic analytics tools can sometimes be hard to interpret or give you more info than you need, so I wanted to build my own system. I wanted to understand simple things like which pages were popular and how long people stayed, but in a way that I could control and keep private.
Solution
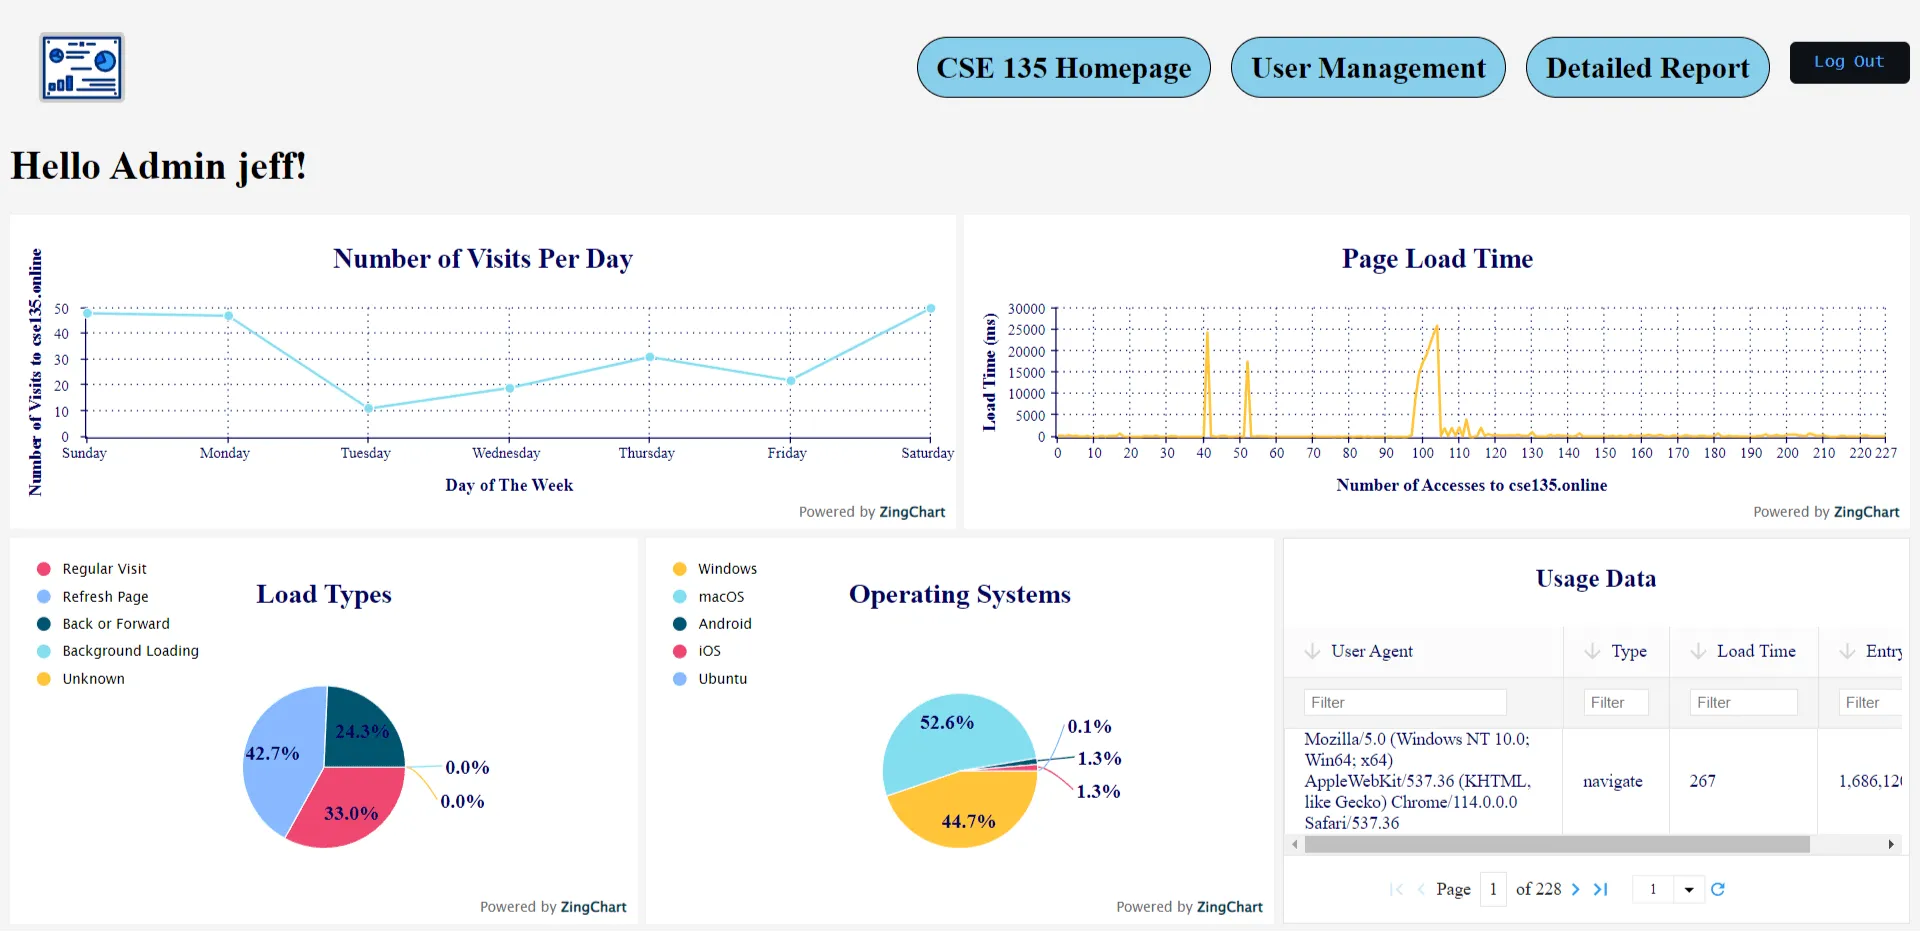
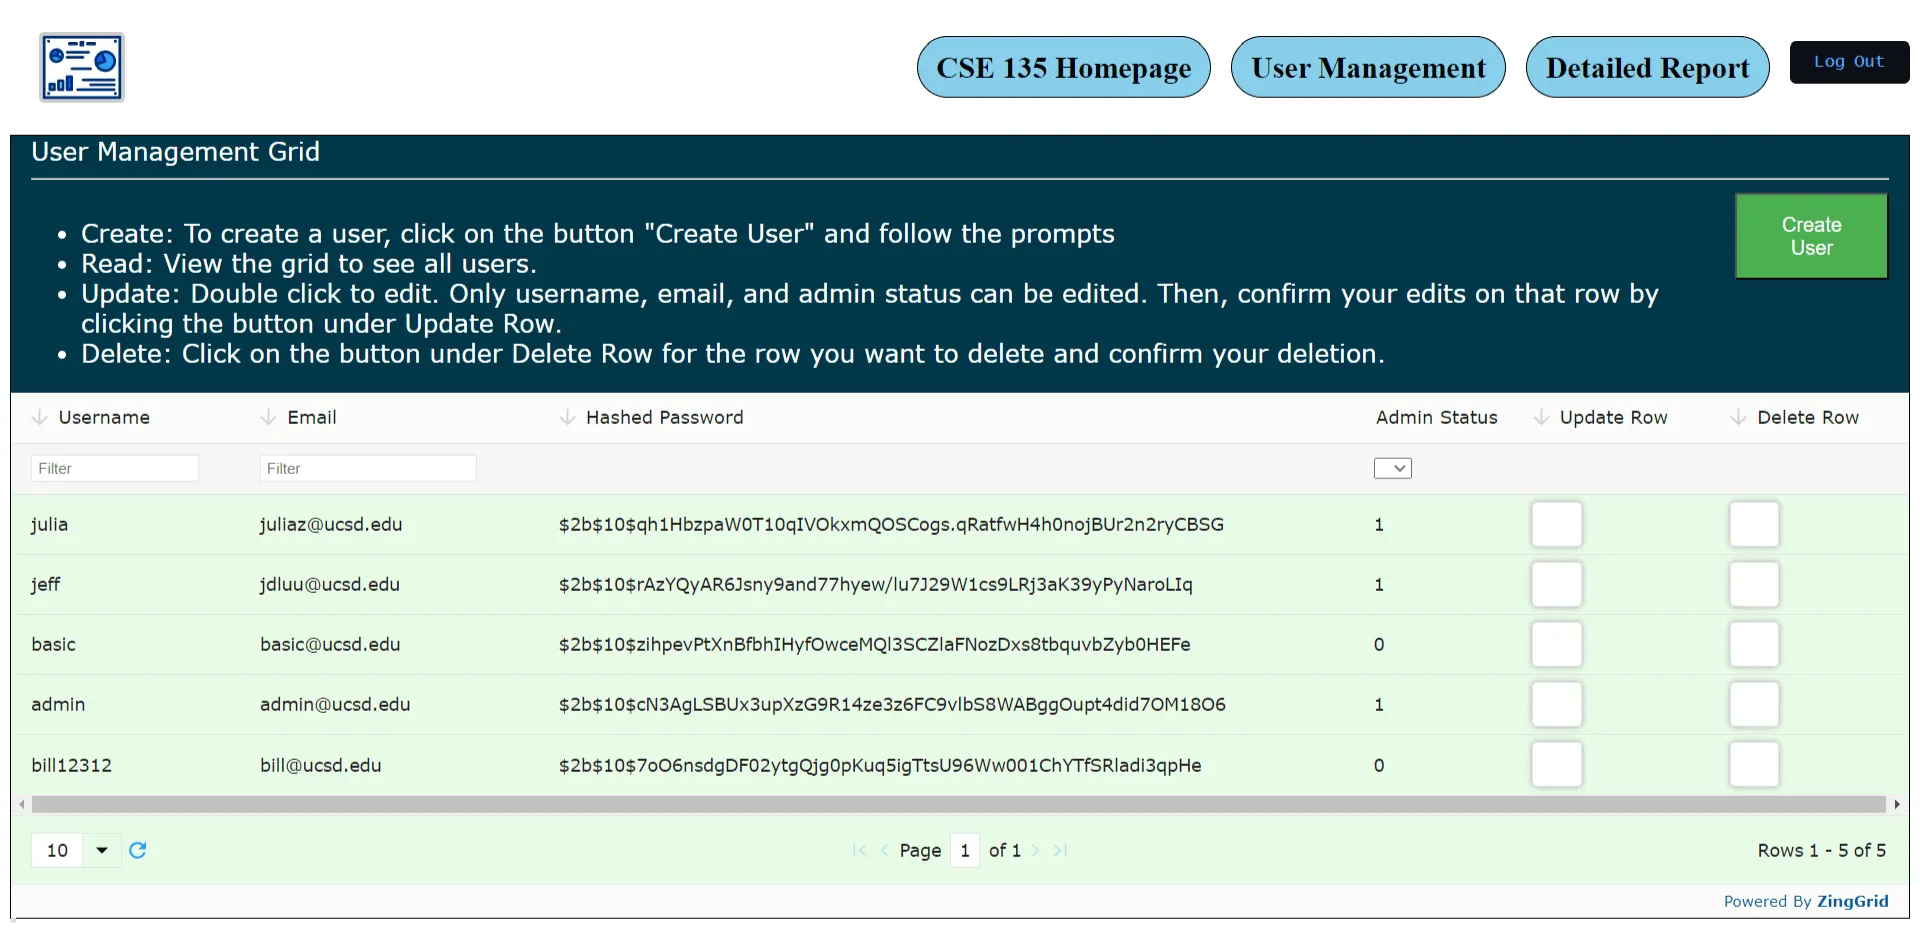
The app collects basic info about site visits and shows it on a private dashboard. I built a database to store all the visit data and created a dashboard with charts and tables so I could see the trends clearly. I also added a secure login so that I am the only one who can see the analytics data for my projects.
Process
I started by deciding which info was actually useful to track, like page views and how long a session lasted. I then built the database to store that data efficiently and wrote the code to collect it from the websites. I spent time building the dashboard interface, adding charts so I could see the data at a glance. I tested the whole process by visiting my sites and making sure the data showed up correctly on the dashboard.
Final Product
Impact
The project gave me a simple and private way to monitor my websites. It helped me move away from guessing how my projects were performing and let me see real data about what was working. It was a good way to see how full stack apps can be used to manage and visualize personal data.
Reflection
Building this was a useful look into how to design a system that handles data over time. I learned how to structure a database for tracking events and how to build a secure interface to view that data. If I were to keep working on this, I would find ways to handle more data without slowing down and add more detailed charts for specific events.