Web Analytics Dashboard
A web application with a custom, secured web analytics dashboard and reporting system.
Timeline
May 2023-June 2023
Technologies
HTML, CSS, JS, Node.js, Express.js, MySQL, ZingChart, ZingGrid
Tools
DigitalOcean, GitHub, MySQL Workbench, Postman
My Responsibilities as Full Stack Developer
- Design scalable software solutions for both front-end and back-end development processes.
- Develop and manage well-functioning databases and applications.
- Implement authentication, authorization, and data protection features.
Background
Data driven decision making is a key component of any successful business. The ability to collect, interpret, and analyze data is a skill that is in high demand. With data, businesses can make decisions that are based on evidence rather than assumptions, which is especially true in web development.
Problem Statement
Data can be interpreted in many ways, many of which are not accurate. Poorly gathered data can lead to poor decisions and results. It is easy to justify a decision based on data that is not accurate. For example, if a website has a high bounce rate, it is easy to assume that the website is not performing well. However, if the website is a single page application, a high bounce rate is expected. The bounce rate is not an accurate measure of the website's performance. The problem is that many web developers do not know how to properly interpret data, and therefore make decisions based on inaccurate data.
Solution
The application of analytics to measure user behavior and website performance enables us to shift our web development standards from assumptions to evidence based on data. Correctly interpreting data allows us to make better decisions and achieve better results. The goal of this project is to create a web analytics dashboard that will allow us to collect, interpret, and analyze data in order to make better decisions and achieve better results.
Development Process
Development began by first noting the requirements of the project as well as what data we wanted to collect and analyze.
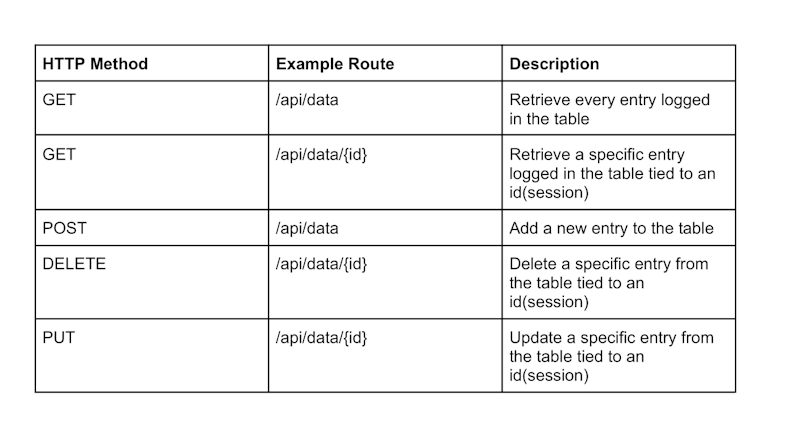
Then, we moved on to designing the database schema and creating the database. Additionally, we planned out our REST API and created the API endpoints.
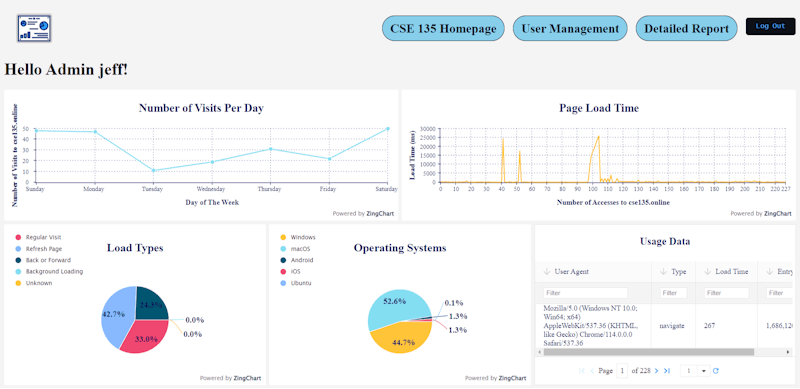
After we had our database and API endpoints, we moved on to creating the front-end of the application. We used ZingChart and ZingGrid to create the charts, tables, graphs, and grids of the dashboard.
Final Product
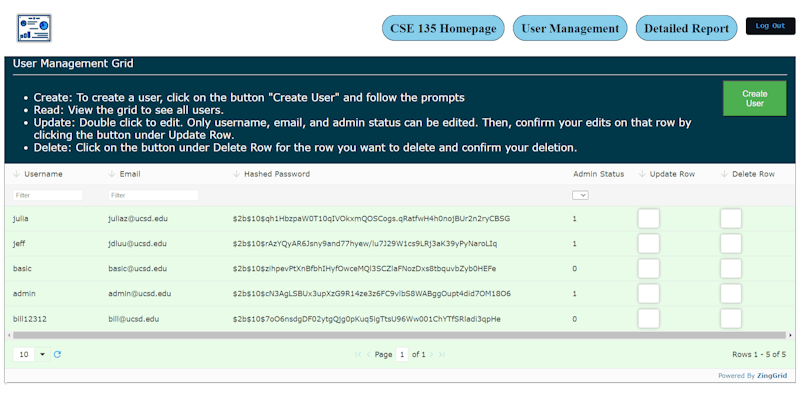
Beyond the home page, I also created a user management page, building our own REST API where admins can add, edit, and delete users.
Reflection
This was an open-ended project where my team and I were given the freedom to choose how we wanted to implement the features. We were given a list of features that we needed to implement, but we were not given any guidance on how to implement them.
One of the core things that we learned was justifying my decisions and weighing tradeoffs. While the modern approach might see the most popular, it is not always the best approach. Many older technologies are still used today because they are more reliable and more secure. I learned how to weigh the tradeoffs between using a modern approach and using an older approach.
Given more time, I would have migrated the client side to React with Tailwind.css to develop a more responsive website faster. I would have also added more features to the dashboard, such as a user profile page, a page to view and edit user settings, and a page to view and edit user permissions.
For further inquiries, please contact me.